What does this indicator measure?
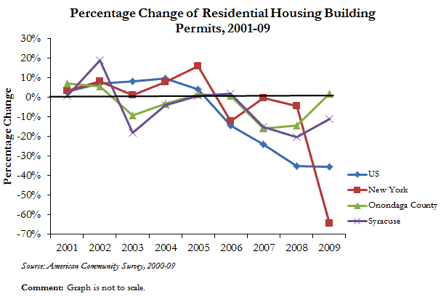
This indicator measures the percentage change in the number of residential building permits issued from one year to the next.
Percentage Change of Residential Housing Building Permits
| 2001 | 2002 | 2003 | 2004 | 2005 | 2006 | 2007 | 2008 | 2009 | |
|---|---|---|---|---|---|---|---|---|---|
| US | 2.8% | 6.8% | 8.1% | 9.6% | 4.1% | -14.7% | -24.0% | -35.3% | -35.6% |
| New York | 3.3% | 7.9% | 1.1% | 7.6% | 15.8% | -12.2% | -0.6% | -4.5% | -64.5% |
| Onondaga County | 6.8% | 5.5% | -9.3% | -3.5% | 1.4% | 0.6% | -15.8% | -14.6% | 1.6% |
| Syracuse | 0.8% | 18.8% | -18.2% | -4.1% | 0.8% | 1.7% | -15.2% | -20.4% | -11.3% |


![Housing Units Authorized by Building Permits [TABLE], 2000-2009](../files/Housing-Units-Authorized-by-Building-Permits-TABLE-2000-2009.png)